Data plays crucial role in not only supporting decisions but also shaping business economy. And interpreting data is extremely important since it offers actionable insights and valuable information to make informed decisions.
Ever since the beginning, most businesses have leveraged Excel until they met with certain limitations like lack of scalability and pivoting, agility, and sophistication modern business demands. There is a report that states around 60% of businesses struggle to fetch real-time access to data, while almost 43% waste time in manual dependency for report generation. Hence, pivoting is knocking door like never before, and if you do not allow, you left behind.
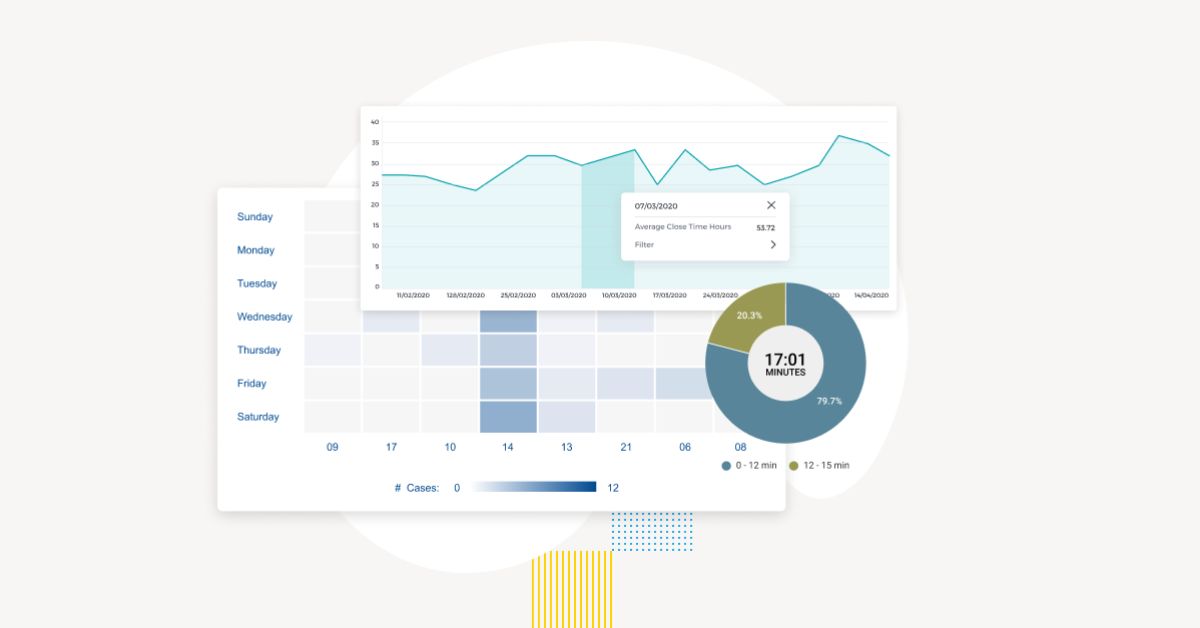
The change you can bring is by adapting Power BI into your business processes. The scalability and intelligence of the tools transforms raw data into interactive dashboards, KPIs, and deep visual analytics.
This article on Power BI vs Excel is all about introducing you to the challenges new-age Power BI can overcome along with the Excel at the backend. Plus, how they both are different, and which analytical tools should be used. So, let’s uncover.
Comparison Table: Microsoft Excel vs Power BI
| Category | Excel | Power BI |
|---|---|---|
| Purpose | Spreadsheet-based analysis, modeling, and calculations | Business Intelligence (BI) tool for interactive data visualization & reporting |
| User Interface | Grid-based interface (cells, rows, columns) | Dashboard and visual-first interface with drag-and-drop canvas |
| Data Handling Capacity | Limited by row count (~1 million rows); performance drops with large data | Optimized for large datasets; supports big data via Power BI Premium |
| Visualizations | Basic charts, graphs, pivot tables | Advanced visuals: heatmaps, slicers, KPI cards, custom visuals via marketplace |
| Data Connectivity | Limited connectors; mostly manual imports | 100+ connectors (SQL, Azure, Google Analytics, Salesforce, etc.); live data support |
| Automation & Refresh | Manual refresh or VBA scripting required | Scheduled data refresh, auto-updates from live sources |
| Collaboration | File sharing via email or cloud (OneDrive) | Real-time collaboration via Power BI Service; role-based access |
| Governance & Security | Limited control; password protection or Office 365 rights | Enterprise-grade security; Azure AD integration, row-level security |
| Learning Curve | Low for basic use; steep for advanced formulas/macros | Moderate; easier for those familiar with data modeling and visualization |
| Mobile Access | Mobile-optimized views limited | Native mobile app with interactive dashboards |
| Custom Calculations | Formulas, macros, VBA scripting | DAX (Data Analysis Expressions), Power Query for complex transformations |
| Scalability | Not scalable beyond personal/team use | Scalable for teams, departments, and enterprise-wide deployment |
| Reporting | Static reports, manual distribution | Interactive, real-time dashboards; embeddable and shareable |
| Cost | Included with Microsoft Office suite | Free (Desktop), Pro (Subscription-based), Premium (Enterprise level) |
| Best For | Individuals, small datasets, financial modeling | Business teams, executives, large data analytics, KPI dashboards |
When Should You Stick with Excel?
- Small Team Size: If you are an individual or part of a small team with no centralization requirement or real-time collaboration, Excel best fits your business
- Low Data Volume: Perfect for analyzing smaller datasets, where performance isn’t impacted by Excel’s row limits.
- Static Reporting Needs: If your reports don’t require frequent updates or real-time data feeds, Excel’s manual workflow is sufficient.
- Existing Expertise: Your team already has strong knowledge of Excel formulas, pivot tables, and macros—no learning curve.
- Cost-Effective Option: Comes bundled with Microsoft Office; no additional cost for licenses or subscriptions.
- Simple Workflows: Best for one-off reports, ad hoc analysis, or tasks that don’t require automation or complex visualization.
- Limited Need for Dashboards: If your stakeholders prefer simple spreadsheets over interactive dashboards, Excel will do the job.
When Should You Upgrade to Power BI?
- Growing Data Volume: You’re working with large, complex datasets that slow down or exceed Excel’s limits.
- Need for Interactive Dashboards: You want to create dynamic, drill-down dashboards for better data storytelling and executive insights.
- Automated Data Refresh: You require real-time or scheduled data updates from multiple sources—no more manual refreshes.
- Team Collaboration & Access Control: Your organization needs cloud-based, role-specific report sharing with version control and security.
- Multiple Data Sources: You’re pulling data from CRM, ERP, cloud apps, databases, and want seamless integration.
- Enterprise-Grade Security: You need data governance, encryption, and user-level permissions built in.
- Mobile-Ready Reporting: You want stakeholders to access live dashboards via mobile devices anytime, anywhere.
- Scalable Reporting Infrastructure: You’re building BI systems for departments or the entire organization, not just individual use.
- Advanced Analytics & Forecasting: You aim to use AI-driven insights, trends, and KPIs for better decision-making.
Conclusion
Microsoft Excel and Power BI are not a competitor, in fact, they go hand in hand across your data journey. Excel helps you with quick calculations, spreadsheets modeling, meticulous analysis. However, it has scalability issues, meaning it stops aiding as you grow, and you have to look for wholesome package, or say, a substitute.
Power BI not only overcomes the challenge that users face with Microsoft Excel but also enable integration, automation, and offers much needed real-time intelligence.
Your obsolete analytical tool can always put you in between scattered reports, inconsistent metrics, or maybe, not able to help you visualize trends. But with Power BI, you would not complain but feel satisfied when your business will thrive even in a cut-throat competition. If you are still confused or unsure, connect with Power BI services provider today, share your requirements, and discover how your business unlocks opportunities.
Also Read: Data Visualization Tools vs Data Analytics


