
Introduction to Analytics and Visualization
Data has become one of the most valuable assets for modern businesses. Organizations across industries depend on their ability to interpret data effectively to stay competitive, improve decision-making, and uncover new opportunities. While the terms data analytics and data visualization tools are often used together, they represent two different aspects of working with data. Understanding their differences is critical for organizations that want to maximize value from their digital transformation initiatives.
Defining Data Analytics
Data analytics is the process of examining data sets to identify patterns, correlations, and insights that can drive better business decisions. It involves a range of methods, from simple descriptive statistics to advanced predictive modeling. Businesses that rely on data analytics services gain access to structured techniques that reveal the story behind the numbers. Analytics can answer questions such as why sales dropped in a given quarter, which marketing campaign generated the highest return, or what future demand may look like.
Analytics goes beyond visual appeal. It is about collecting raw data, cleaning and organizing it, and applying statistical models or machine learning algorithms to uncover actionable knowledge.
Defining Data Visualization Tools
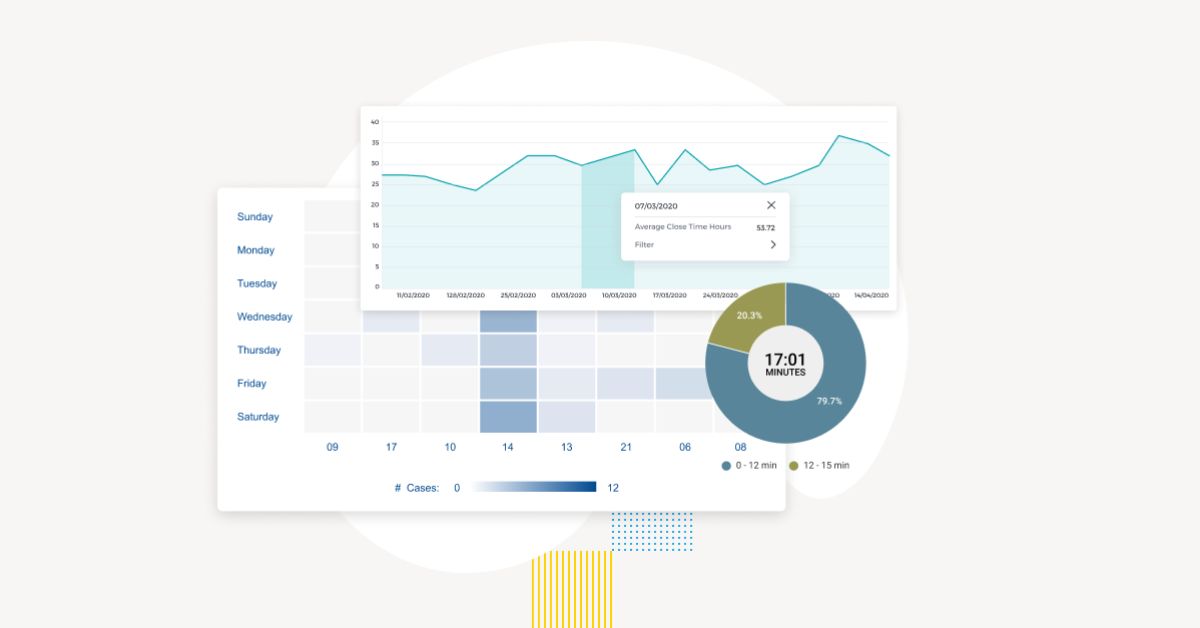
Data visualization tools, on the other hand, focus on the graphical representation of data. They transform raw or processed data into visual forms such as dashboards, charts, or maps. The goal of visualization is to make insights easier to understand at a glance.
Visualization tools are especially valuable for non-technical stakeholders who may not be familiar with statistical analysis. By leveraging the expertise of data visualization service providers, organizations can turn complex datasets into meaningful graphics that can be used for presentations, performance tracking, and strategy development.
Key Differences Between Analytics and Visualization
Although analytics and visualization are closely connected, they serve different purposes within the data ecosystem. Analytics is the engine that processes information, while visualization is the lens that makes results comprehensible. Analytics answers the “why” and “what next,” whereas visualization answers the “how does it look” and “how can it be communicated.”
For example, a data analyst may use advanced models to forecast customer churn. The visualization tool then translates those forecasts into a chart that executives can easily interpret to plan retention strategies.
How They Work Together
Despite their differences, analytics and visualization are complementary. Analytics generates insights that may be hidden in large volumes of data, and visualization ensures those insights are presented in an accessible manner. Together, they close the gap between technical findings and business decisions.
This collaboration is most effective when supported by strong data managed services. Clean, secure, and well-structured data ensures analytics produces reliable outcomes, which visualization can then highlight in a clear and meaningful way. Without managed data infrastructure, both analytics and visualization may suffer from inconsistency or inaccuracy.
Real-World Applications of Analytics and Visualization
The differences between analytics and visualization become clearer when examining industry examples.
In healthcare, analytics may identify trends in patient outcomes, while visualization presents these findings in dashboards that hospital administrators can use to improve care strategies. In finance, analytics can model credit risks, and visualization helps risk officers interpret complex probability distributions in simple, color-coded charts. In retail, analytics uncovers customer behavior patterns, while visualization creates performance dashboards to track sales across multiple regions.
Each application demonstrates that analytics uncovers knowledge, and visualization communicates it effectively.
Challenges in Differentiating the Two
Many organizations struggle to differentiate between data analytics and visualization because both are often integrated into the same platforms. For instance, modern business intelligence software combines advanced analytics features with visualization dashboards. This integration sometimes leads to confusion, where visualization is mistaken for analytics itself.
However, the distinction remains important. Visualization alone cannot explain why certain patterns exist; it simply displays them. Analytics provides the context and reasoning behind those visuals. Recognizing this difference ensures businesses do not misinterpret data or oversimplify decision-making processes.
Future Outlook for Analytics and Visualization
The future of both analytics and visualization is being shaped by artificial intelligence and automation. Analytics is moving toward predictive and prescriptive models, where algorithms not only analyze data but also recommend actions. Visualization is evolving into more interactive and immersive experiences, including augmented reality dashboards and real-time visual storytelling.
As organizations grow more data-driven, the integration of analytics and visualization will become seamless, but their individual roles will remain distinct. Businesses that understand this distinction will be better equipped to design strategies that maximize their data’s value.
FAQs on Analytics vs Visualization
What is the main difference between data analytics and visualization?
Data analytics involves processing and interpreting data to find insights, while visualization focuses on presenting those insights in a graphical or visual format for easier understanding.
Can data visualization exist without analytics?
Visualization without analytics only presents raw data, which may not be useful for decision-making. Analytics is needed to interpret the data meaningfully before visualization adds value.
Why are visualization tools important if analytics already provides insights?
While analytics uncovers insights, visualization tools make those insights accessible to non-technical audiences. They allow stakeholders to act on information quickly and confidently.
Do all industries need both analytics and visualization?
Yes. Whether in healthcare, finance, retail, or logistics, analytics and visualization work together to improve efficiency, reduce risk, and support data-driven strategies.
How do managed services enhance both analytics and visualization?
Managed services ensure data is accurate, secure, and well-organized. This foundation enables analytics to produce reliable insights and visualization to display meaningful outcomes.
Are visualization tools considered part of analytics?
They are related but distinct. Visualization is often used within analytics platforms, but it is a separate function focused on communication rather than computation.
Why Choose Expert Support in Analytics and Visualization
Both analytics and visualization require expertise to deliver meaningful results. Organizations that work with experienced consultants and providers gain a strategic advantage, as professionals can design frameworks that combine analytical rigor with visual clarity. This ensures data is not only collected and processed but also transformed into actionable intelligence that drives growth and efficiency.
Contact Line
Unlock the full potential of your data by exploring tailored analytics and visualization solutions that align with your business objectives.
Special thanks to the Global Newz for letting us share this valuable blog.
Data plays crucial role in not only supporting decisions but also shaping business economy. And interpreting data is extremely important Read more