
Top Benefits of Using Power BI Templates for Faster Business Insights
In the data-driven age, companies are that much more reliant on the ability to make fast decisions. However, scraping, processing, and visualizing data can be challenging. That’s where Power BI templates come in and save the day. With pre-built dashboards and reports, Organizations can leapfrog to collaborative data analysis and reduce the time spent reinventing the wheel.
Here, we’re going to detail the best advantages of Power BI templates and discuss all they have to offer for enterprises in any market.
-
Time-Saving and Efficient Reporting
Building a dashboard from scratch requires hours of setting up visualization styles and formats. This effort can be streamlined with Power BI templates, which are predefined templates for everyday use cases. Using templates, customers can easily connect their data sources and start generating beautiful dashboards immediately.
This timesaving functionality will especially benefit executives and analysts who must provide analysis quickly, rather than spending days designing reports. Whether it’s monthly sales results, financial overviews, or KPIs for operations, templates help create reports at a faster pace, allowing companies to respond quickly.
-
Consistency Across Reports
Some organizations struggle to adhere to a specific report format. Teams can create dashboards in different ways, making it hard to measure or benchmark insights.
This problem makes Power BI templates a viable solution, as we can enforce a standard report for everyone. Following the same colour scheme, metrics, and design elements, companies can keep clean and professional dashboards throughout all departments. This uniformity helps ensure clarity and makes sure that the data means the same thing to all stakeholders.
-
Easy Customization for Business Needs
While its templates are pre-designed, they can be customized to a great extent. It’s straightforward for businesses to personalize Power BI templates with their own KPIs, metrics or branding. A sales dashboard template could be filtered by region into customer segments or product categories based on the options provided above, aligning with the company’s goals.
It is this combination of structure and flexibility that provides businesses with the speed and custom touch that they need, which is why templates can work for companies of any size or industry.
-
Enhanced Collaboration Across Teams
For most companies, data can be found throughout their organization, spread across various departments, including sales, finance, operations, and more. Lack of a uniform reporting tool can be challenging to collaboration.
Power BI templates encourage collaboration by providing teams with a common framework and workspace. For example, a finance department can use the same budgeting template that the operations team relies upon, so everyone is on the same page regarding business performance. This common understanding fosters better communication, facilitates quicker decision-making, and promotes more effective teamwork.
-
Reduced Learning Curve for New Users
This is because not everyone in a company will have power-user skills in data visualization. Power BI templates are a good initial way to examine dashboard Creation for newcomers in the field—no more fighting over managing charts and layout, instead concentrating on data analysis and gaining knowledge of insights.
This simplicity of use means that templates are an excellent tool for educating new employees, educating teams, and enabling staff who are not tech-savvy to work with data in everyday work.
-
Scalability for Enterprise Reporting
The reporting requirements of businesses become more intricate as they expand. It is neither cost-effective nor efficient to build new dashboards for every requirement. Power BI templates grow as the organization grows by providing reusable frameworks.
Businesses can design industry-specific templates, such as those for retail sales, healthcare patient management, or supply chain operations, and apply them to multiple units or branches. This scalability means less repetition and faster deployment of new reports.
Conclusion
At a time when insights are more critical than ever to the success of any business, Power BI templates provide a boost to an organization’s window of opportunity to take action. They save time, provide consistency, are easily customizable, and allow for collaborative work—all while reducing expenses. Whether you’re a small business owner who needs easy reporting tools or a big company that needs to cut analytics down in every department, Power BI templates are a good way to start.
Using templates, companies can spend less time creating dashboards and more time making smarter, data-driven decisions, all in a quicker manner than ever.
FAQs About Power BI Templates
Q1. What are Power BI templates?
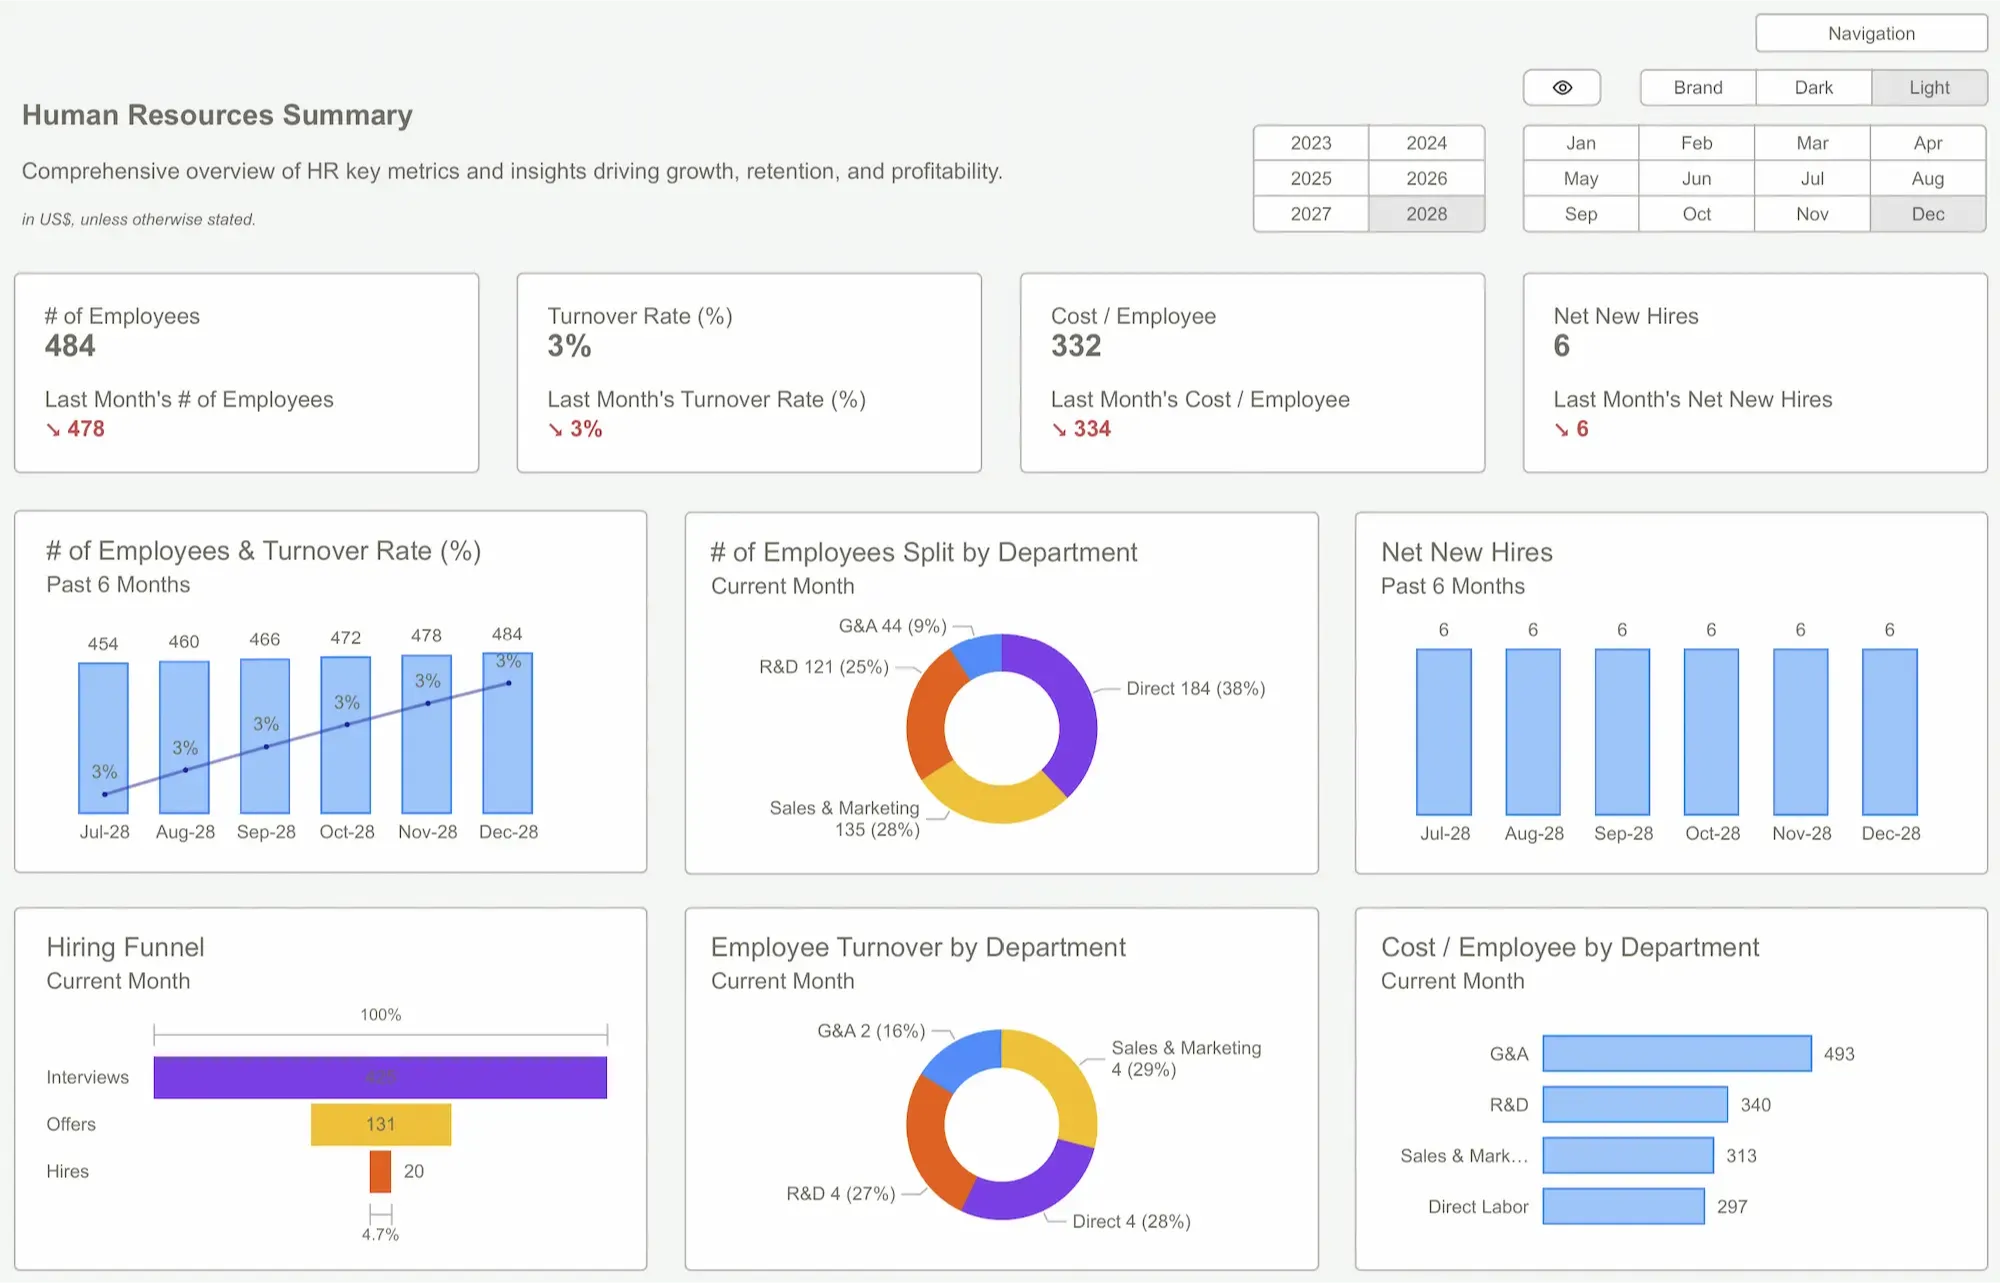
Power BI templates are pre-built dashboards and reports designed for common business use cases. They allow organizations to connect data sources quickly and start visualizing insights without building everything from scratch.
Q2. How do Power BI templates save time?
Instead of spending hours designing dashboards, templates provide ready-to-use frameworks. Executives and analysts can generate reports faster—whether for sales, finance, or operations—allowing businesses to make quicker decisions.
Q3. Can Power BI templates be customized for specific business needs?
Yes. Templates can be tailored with custom KPIs, metrics, filters, and branding. For example, a sales dashboard can be adjusted to focus on regions, customer groups, or product categories based on company priorities.
Q4. Do Power BI templates ensure consistency across departments?
Absolutely. Templates enforce a standardized format for dashboards, ensuring that all teams follow the same color schemes, metrics, and layouts. This helps keep reports professional and ensures everyone interprets data the same way.
Q5. Are Power BI templates suitable for beginners?
Yes. They reduce the learning curve by providing structured dashboards that don’t require advanced data visualization skills. This makes it easier for new employees or non-technical staff to analyze data and gain insights.